











FCFS Scheduling Examples
In the FCFS (First-Come, First-Served) scheduling algorithm, the CPU executes the processes in the order of their arrival time. We can say that the process that comes first to the CPU will be served first.
In FCFS scheduling
- A process that comes first in the ready queue will get the CPU first
- If more than one process arrives at the same time, then the process that contains a smaller process ID or order number will be executed first.
- FCFS is a non-preemptive scheduling; it means once a process starts its execution, it will continue until it completes or goes for some I/O
In this lecture, we will see multiple examples of FCFS scheduling with their Gantt charts, completion time (CT), waiting time (CT), turnaround time (TAT), Average Waiting Time (AWT), and Average Turnaround Time (ATAT). We will see various categories of FCFS, which involve I/O time, same arrival time, different arrival time, and many more
Formulas that will be used in this lecture are given below
|
Note:
- Completion time is also called exit time; similarly, execution time is also called Burst time.
- Gantt Chart is a timeline that shows the order of process execution and their completion time.
FCFS Scheduling Example: 01
Consider there are 4 processes (P1, P2, P3, and P4) with their arrival and burst times, which are given in the following diagram
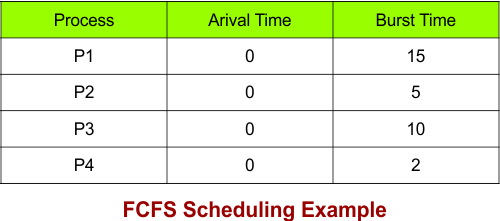
By using FCFS scheduling, calculate completion time (CT), waiting time (WT), turnaround time (TAT), average waiting time (AWT), and average turnaround time (ATAT).
Solution
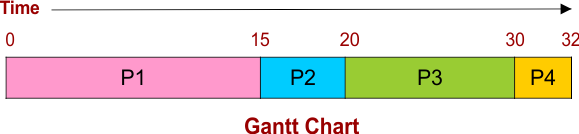
Gantt Chart of Example 1 is given below
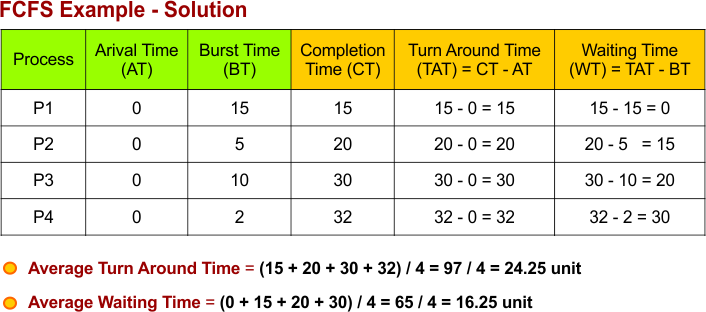
All Calculations
The following diagram calculates completion time (CT), waiting time (WT), turnaround time (TAT), average waiting time (AWT), and average turnaround time (ATAT).
Ready Queue and Gantt Chart Behaviour in Example 1
At time 0:
Since all processes arrive at the same time (“0”), they are executed in the order they are placed in the ready queue. As Process 1 has a smaller ID number, it is placed in the ready queue first and P4 last.
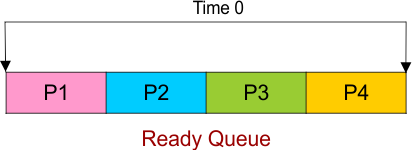
P1 is ready to execute.
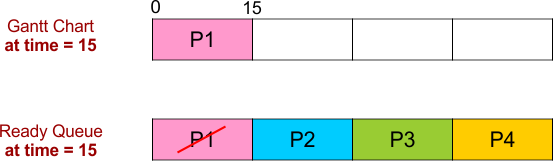
At time 15:
P1 completes its execution at time 15. The Ready Queue contains P2, P3, and P4, where P2 is in front of the ready queue, so now it will be executed by the CPU.
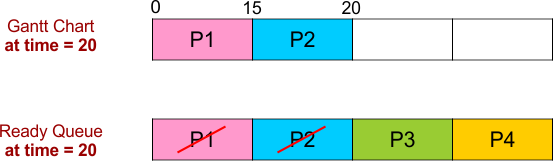
At time 20:
P2 completes its execution at time 20. The Ready Queue contains P3 and P4, where P3 is in front of the ready queue, so now it will be executed by the CPU.
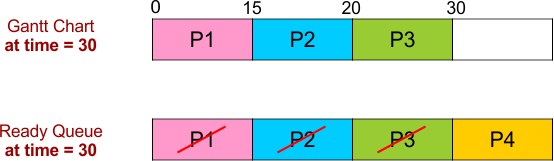
At time 30:
P3 completes its execution at time 30. The Ready Queue contains only P4, which is in front of the ready queue, so now it will be executed by the CPU.
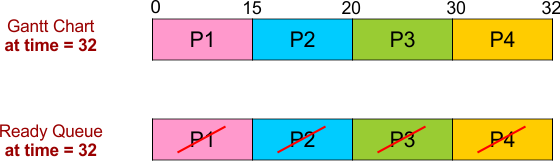
At time 32:
P4 completes its execution at time 32. The Ready Queue contains nothing. That’s all
FCFS Scheduling Example: 02
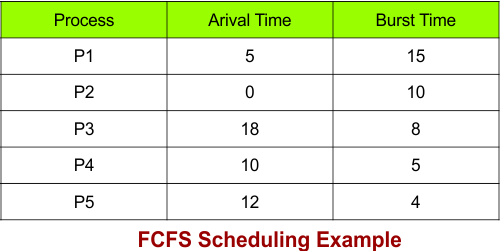
Consider there are 5 processes (P1, P2, P3, P4, and P5) with their arrival and burst times, which are given in the following diagram
Solution
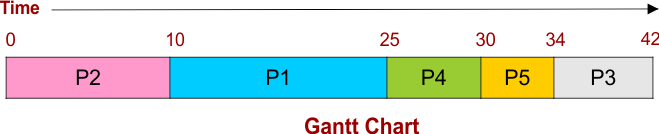
Gantt Chart of Example 2 is given below
All Calculations
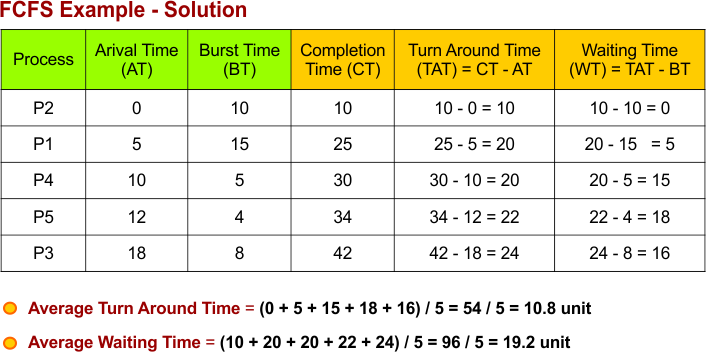
The following diagram calculates completion time (CT), waiting time (WT), turnaround time (TAT), average waiting time (AWT), and average turnaround time (ATAT).
Ready Queue and Gantt Chart Behaviour in Example 2
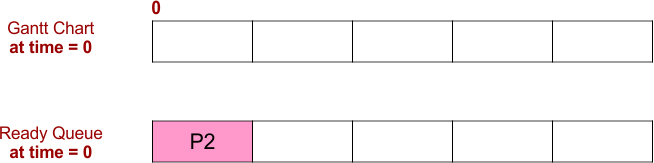
At time 0:
As P2 arrives at time 0, it is placed in the ready queue first. No other process arrives yet. So the CPU gets it.
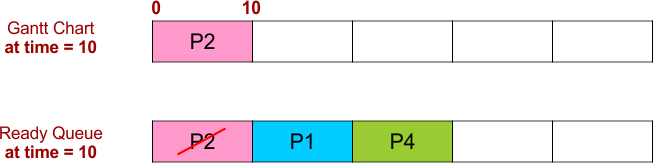
At time 10:
P2 completes its execution at time 10. The Ready Queue contains P1 and P4, where P1 is in front of the ready queue, so now it will be executed by the CPU.
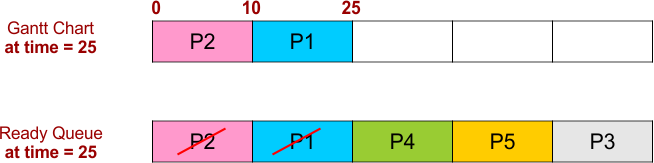
At time 25:
P1 completes its execution at time 25. The Ready Queue contains P4, P5, and P3, where P4 is in front of the ready queue, so now it will be executed by the CPU.
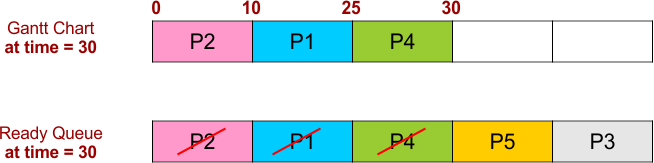
At time 30:
P4 completes its execution at time 30. The Ready Queue contains P5 and P3, where P5 is in front of the ready queue, so now it will be executed by the CPU.
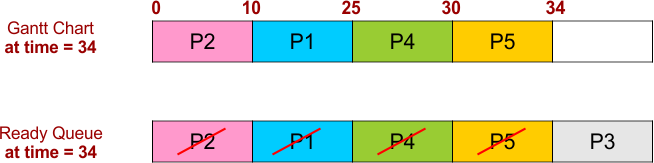
At time 34:
P5 completes its execution at time 34. The Ready Queue contains only P3, so now it will be executed by the CPU.
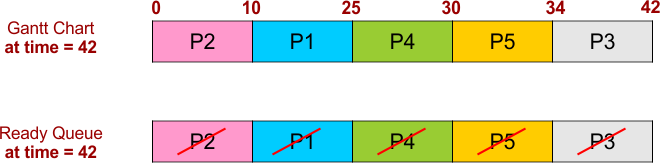
At time 42:
P3 completes its execution at time 42. The Ready Queue contains nothing. That’s all
FCFS Scheduling Example: 03
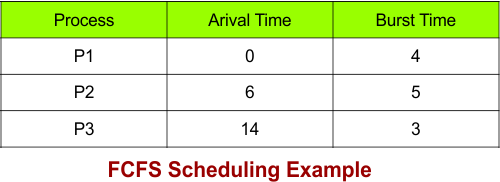
Consider there are 5 processes (P1, P2, and P3) with their arrival and burst times, which are given in the following diagram
Solution
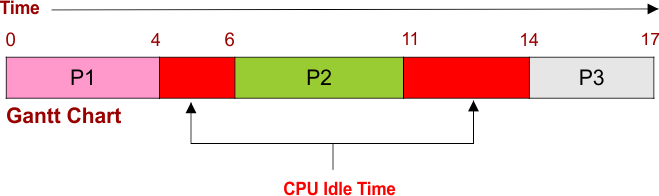
Gantt Chart of Example 3 is given below
All Calculations
The following diagram calculates completion time (CT), waiting time (WT), turnaround time (TAT), average waiting time (AWT), and average turnaround time (ATAT).
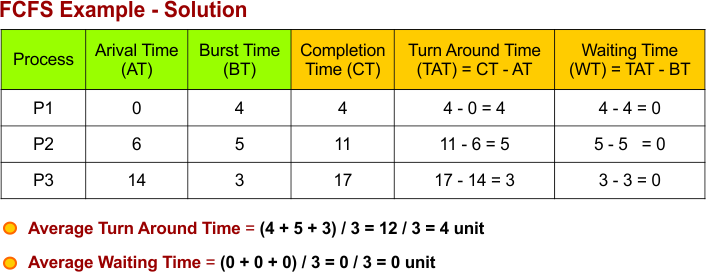
Ready Queue and Gantt Chart Behaviour in Example 3
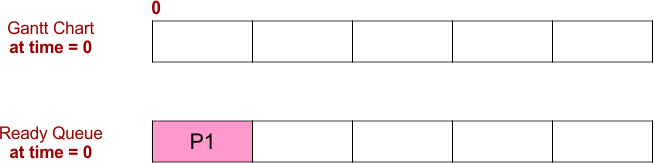
At time 0:
As P1 arrives at time 0, it is placed in the ready queue first. No other process arrives yet. So the CPU gets it.
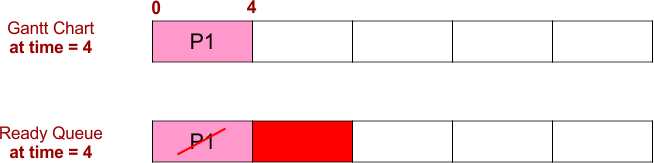
At time 4:
P1 completes its execution at time 4. The Ready Queue contains nothing at this point, so it will wait for new process to come.
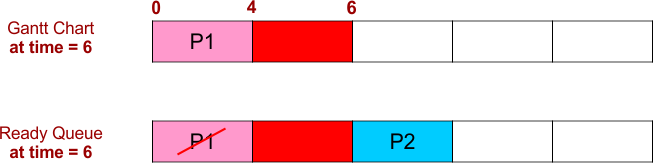
At time 6:
As P2 arrives at time 6, it is placed in the ready queue first. No other process arrives yet. So the CPU gets it.
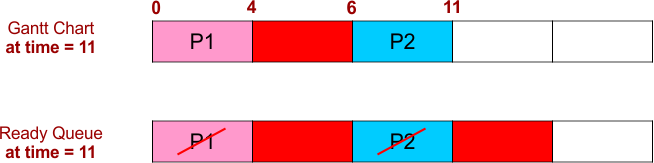
At time 11:
P2 completes its execution at time 11. The Ready Queue contains nothing at this point, so it will wait for a new process to come.
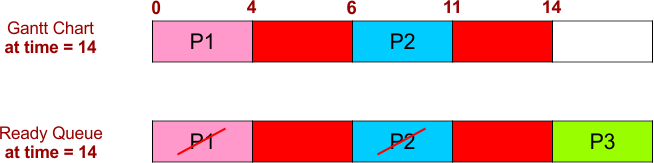
At time 14:
As P3 arrives at time 14, it is placed in the ready queue first. No other process arrives yet. So the CPU gets it.
At time 17:
P3 completes its execution at time 17. The Ready Queue contains nothing at this point, so it will wait for a new process to come.
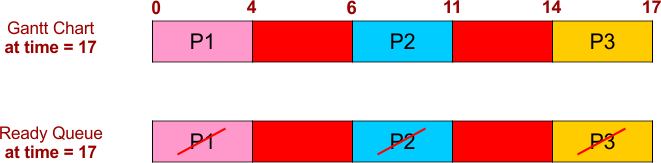
That’s all; no process remains to execute.
FCFS Scheduling Example: 04
Consider there are 4 processes (P1, P2, P3, and P4) with their arrival and burst times, which are given in the following diagram
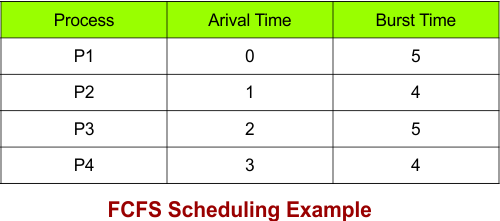
Assume the context switching time is 2 units of time
Solution
Gantt Chart of Example 4 is given below
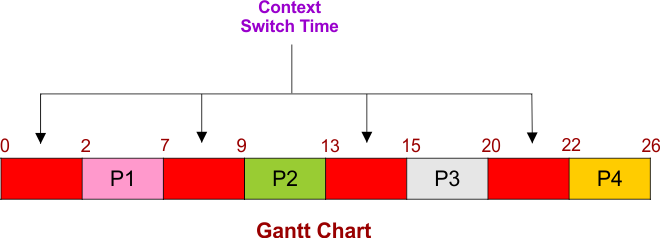
Note: Switching the CPU from one process to another consumes some time called context switching. The OS does it.
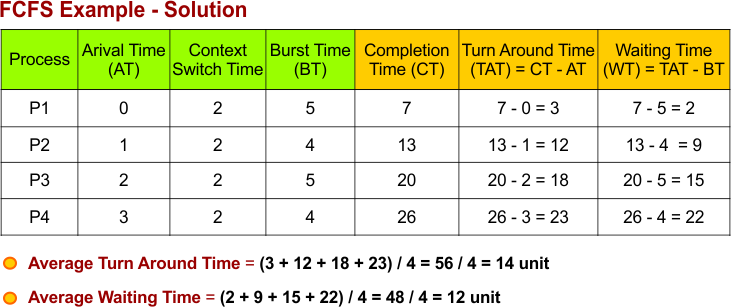
All Calculations
The following diagram calculates completion time (CT), waiting time (WT), turnaround time (TAT), average waiting time (AWT), and average turnaround time (ATAT).
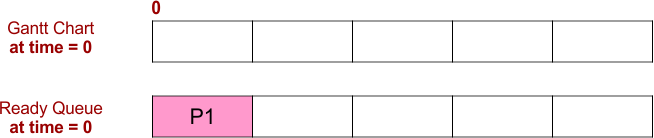
Ready Queue and Gantt Chart Behaviour in Example 4
At time 0:
As P1 arrives at time 0, it is placed in the ready queue first. No other process arrives yet. So the CPU gets it after 2 units of context switching.
At time 7:
P1 completes its execution at time 7. P1 arrives at time “0” but it has to wait for 2 units of time for context switching. The Ready Queue contains P2, P3, and P4 in ready queue.

- Note: Red Box shows the context switching
At time 13:
P2 completes its execution at time 13. The Ready Queue contains P3 and P4 in the ready queue.

At time 20:
P3 completes its execution at time 20. The Ready Queue contains only P4 in the ready queue.

At time 26:
P4 completes its execution at time 26. The Ready Queue contains nothing

All processes are executed successfully. That’s all
FCFS Scheduling Example: 05
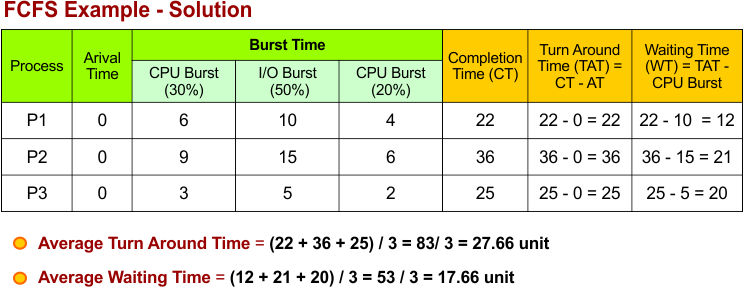
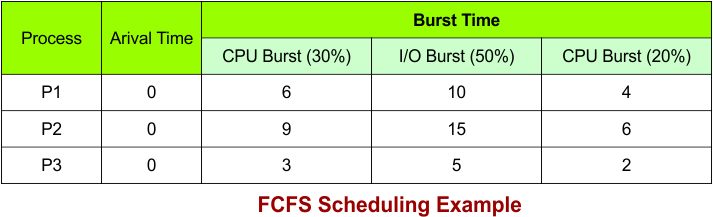
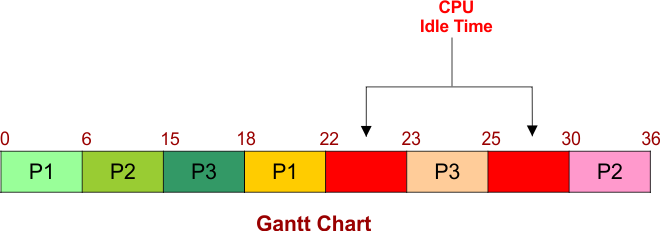
Consider there are 3 processes (P1, P2, and P3) that arrive at time “0” with process times of 20, 30, and 10, respectively, where each process uses the
- First 30% of its process time in CPU,
- Then 50% in I/O,
- And the last 20% in CPU
Find completion time (CT), waiting time (WT), turnaround time (TAT), average waiting time (AWT), and average turnaround time (ATAT). The following diagram shows the question in simple form
Solution
Gantt Chart of Example 4 is given below
All Calculations
The following diagram calculates completion time (CT), waiting time (WT), turnaround time (TAT), average waiting time (AWT), and average turnaround time (ATAT).